SHARE Knowledge Hub
HSE workplace fatalities and serious injuries
HSE’s statistics release of 19 November 2026 covers health and safety in Great Britain. The worker fatality figure remains 126 for 2025/26 and is provisional. HSE also estimates 688,000 workers sustained a non-fatal injury and 1.8 million workers experienced work-related ill health in 2025/26. Northern Ireland reports separately.
Understanding HSE workplace fatalities and serious injuries
HSE’s statistics release of 19 November 2026 covers health and safety in Great Britain. The worker fatality figure remains 126 for 2025/26 and is provisional. HSE also estimates 688,000 workers sustained a non-fatal injury and 1.8 million workers experienced work-related ill health in 2025/26. Northern Ireland reports separately.
Why this matters at work
Large historical improvements do not make the remaining harm acceptable or demonstrate that today’s controls are effective. Deaths continue each year, and serious injuries can permanently affect mobility, sight, independence and earning capacity. The practical aim is to remove the work conditions that allow fatal or severe injury, while continuing to learn from incidents and workers’ experience.
Third, priorities need both burden and risk. Construction has the largest matched-period fatal count; agriculture has the highest main-industry pooled fatal rate. Manufacturing, health and social work, trade, transport and education contribute large specified-injury burdens. Organisations should identify the corresponding local harm pathways rather than assume every workplace in a sector has the same risk.
How organisations manage this in practice
The moral conclusion is that sustained prevention remains necessary even where a national trend improves. The operational conclusion is to prioritise credible fatal and severe-injury scenarios, redesign work at source and verify that controls work in real conditions. Neither conclusion depends on attributing the national decline to one programme.
Fourth, stronger assurance should accompany every dashboard. Check whether dangerous energy or exposure is eliminated, separated or controlled, particularly during non-routine work. Verify actions, learn from high-potential events and protect honest reporting. The intended output is less exposure to serious harm, not a cosmetically lower report count.
The manager approves the layout and resources. Before release, a competent supervisor tests sightlines, gate operation, route continuity and the loading interface without exposing pedestrians to live movements. During use, report damage, encroachment or work changes immediately. Stop the affected movement if the barrier or crossing control fails. Brief drivers and visitors on the remaining arrangements. Keep the layout decision, verification, defects and corrective actions; hand the route back only when the required controls are effective.
Specified injuries are the strongest available consistent serious-injury marker in the modern industry tables. They include defined fractures, amputations and other injuries with the potential for major harm. They are not all confirmed life-changing injuries, and the statistics do not measure how many injured people have a permanent disability. Conversely, permanent harm can also occur outside that category. HSE’s specified injury definitions should govern the wording used in a briefing or dashboard.
What did HSE publish for Great Britain on 19 November 2026?
HSE published its annual health and safety statistics on . The latest worker fatality figure remains 126 in 2025/26. That figure is provisional and HSE expects to finalise it in July 2027.
Download the full SHAREhub report (PDF)
The 11-page SHAREhub report includes source-linked charts, sector comparisons, explanations to test and implications for prevention.
| Measure | Figure | Period and source |
|---|---|---|
| Workers killed in work-related accidents | 126 | 2025/26, provisional. Includes employees and the self-employed. |
| Workers sustaining a non-fatal workplace injury | 688,000 | 2025/26 LFS estimate. |
| Employee non-fatal injury reports | 58,298 | 2025/26, provisional RIDDOR. 16,929 specified and 41,369 over-seven-day injuries. |
| Work-related ill health | 1.8 million | 2025/26 LFS. About 1.809 million new or long-standing cases, including 699,000 new cases. |
| Stress, depression or anxiety | 891,000 | 2025/26 LFS prevalence, including 357,000 new cases. |
| Musculoskeletal disorders | 477,000 | 2025/26 LFS prevalence, including 172,000 new cases. |
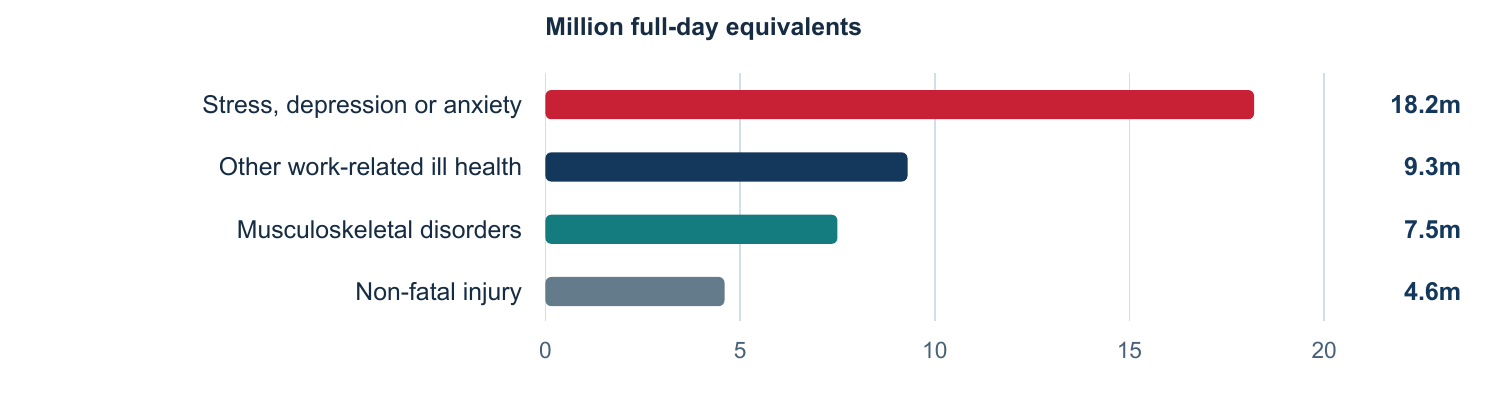
| Working days lost to ill health and non-fatal injury | 39.6 million | 2025/26 LFS. About 35.0 million for ill health and 4.6 million for injury. |
| Mesothelioma deaths | 2,146 | Calendar year 2024. Deaths recorded on death certificates. |
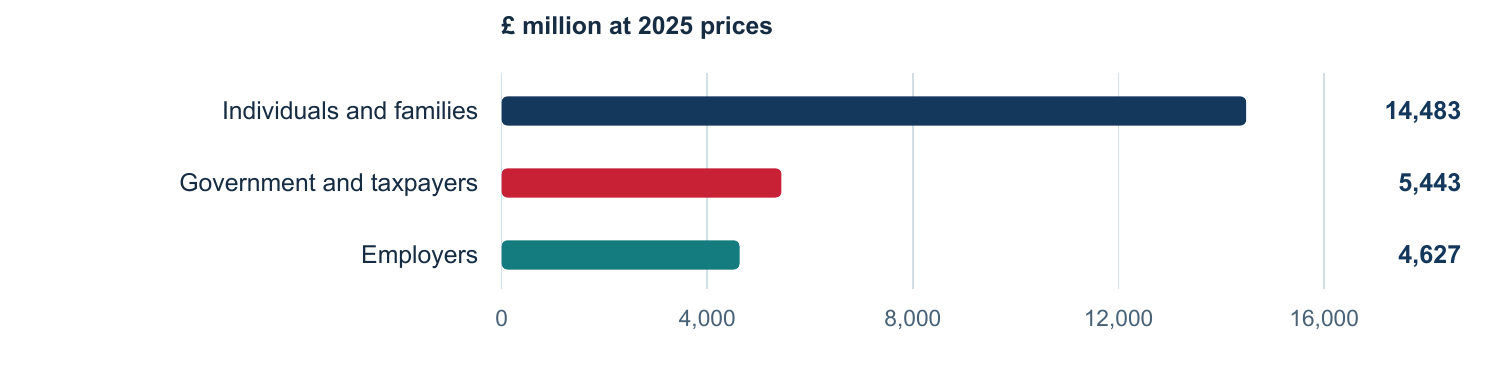
| Cost of workplace injury and new ill health | £24.6 billion | Three-year estimate centred on 2024/25, at 2025 prices. Excludes long-latency illness such as cancer. |
See the official HSE 2026 booklet and HSE’s 2025/26 fatal injury statistics.
What do the latest injury trends show in Great Britain?
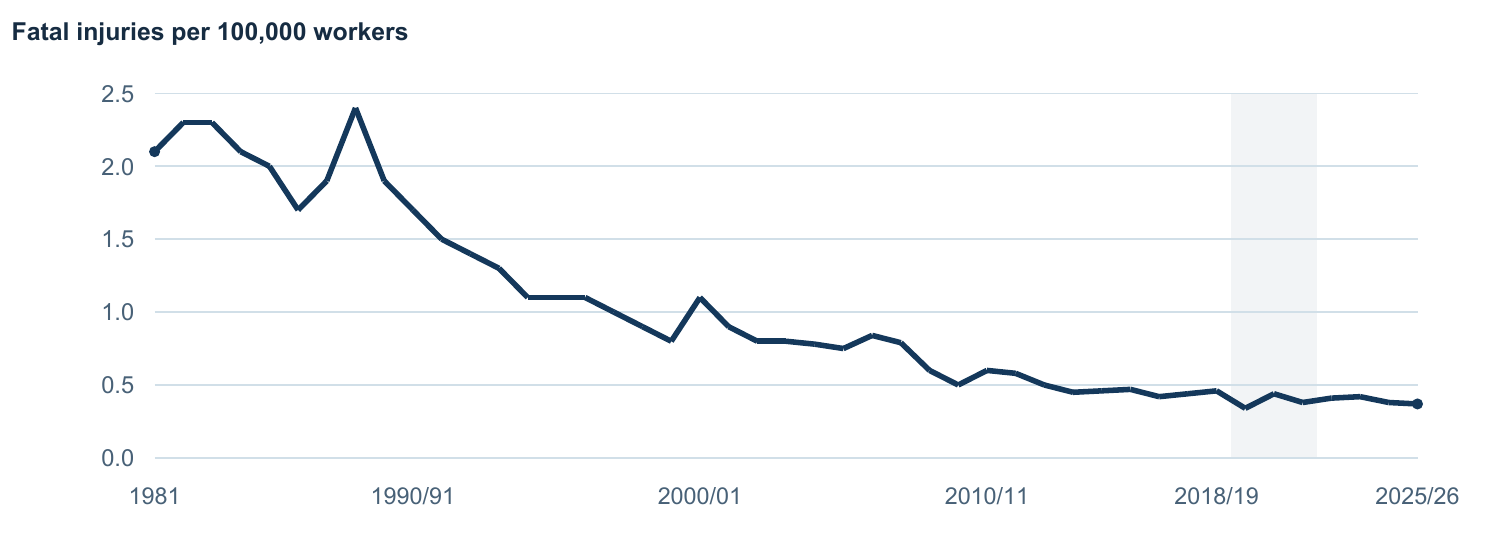
The worker fatal injury rate is far below its 1981 level, and the pace of improvement has slowed. HSE describes the recent worker survey injury rate as broadly flat across the last four years. Employer-report rates continue their longer downward trend.
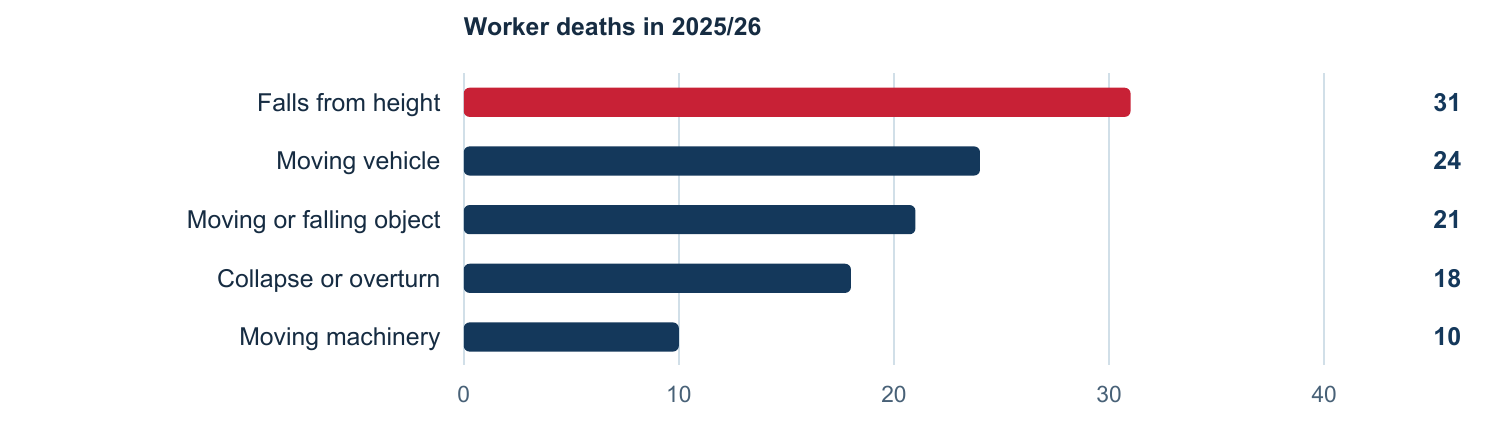
The fatal rate fell from 2.10 per 100,000 workers in 1981 to 0.37 in 2025/26, about 82% lower. The latest provisional count of 126 compares with the revised count of 128 in 2024/25. Falls from height, moving vehicles, moving objects, collapse or overturn, and moving machinery accounted for 104 of the 126 deaths.
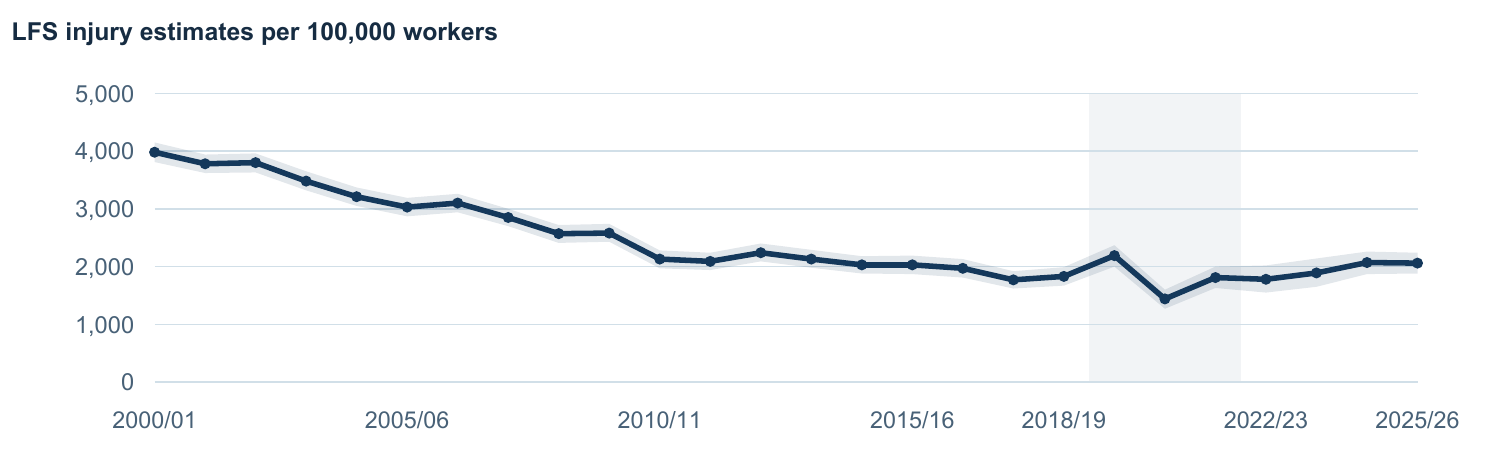
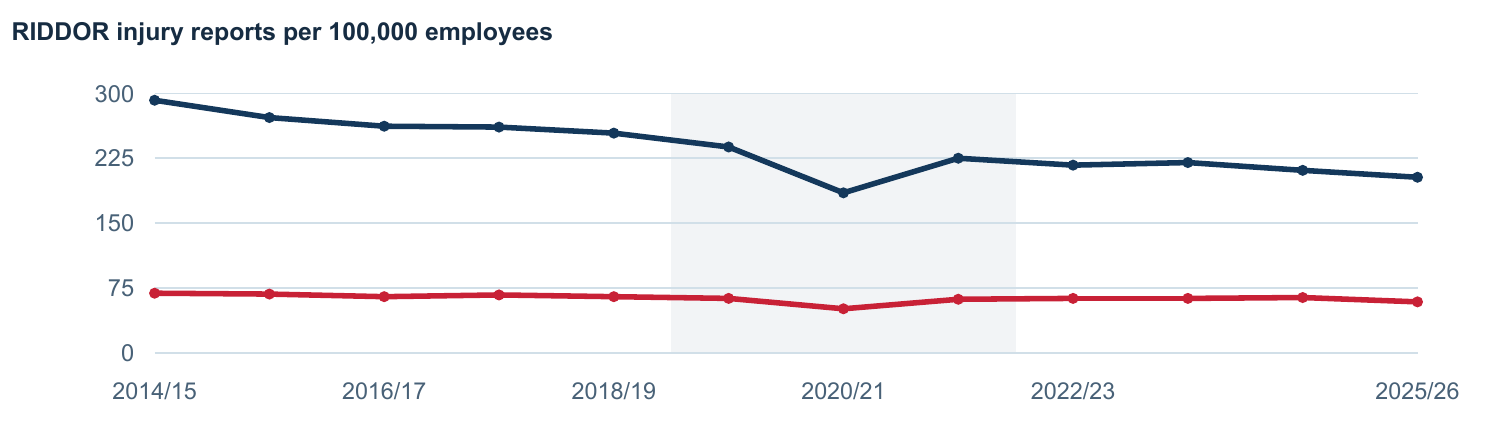
In 2025/26 the LFS estimated 2,060 non-fatal injuries per 100,000 workers, versus 2,070 a year earlier. HSE found no statistically significant difference. The RIDDOR employee report rate fell from 211 to 203 per 100,000 employees. The report count fell from a revised 59,931 to a provisional 58,298. The two sources cover different populations and injury thresholds.
See the other injury charts
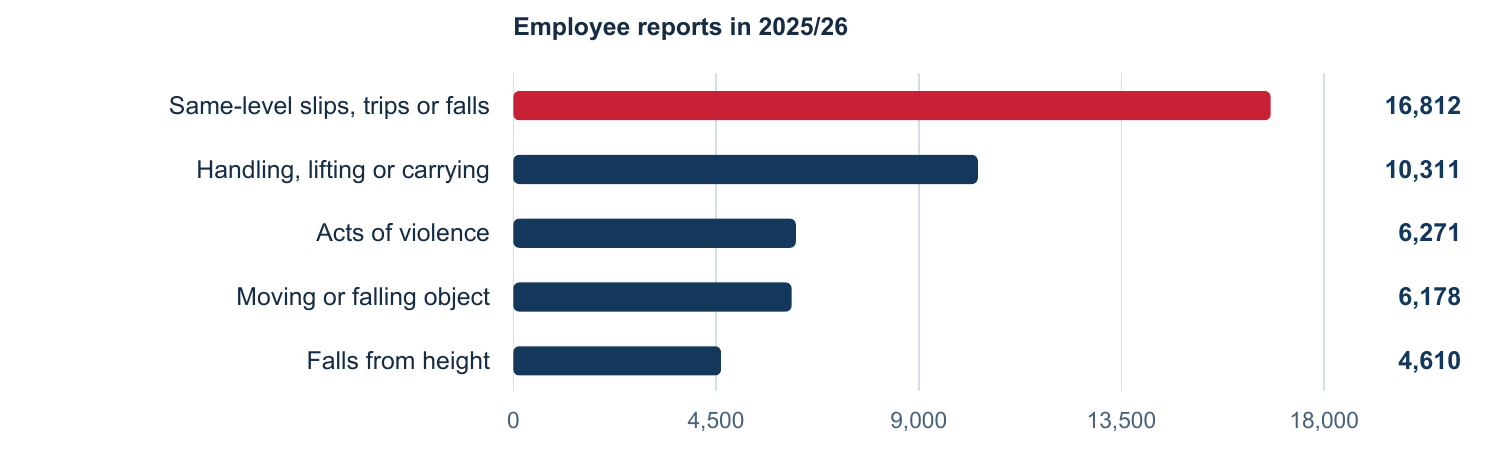
What do the latest Great Britain figures show about ill health and lost time?
Reported work-related ill health remains above pre-pandemic levels. The latest rate of 5,140 per 100,000 workers is about 27% above 2018/19. HSE found no statistically significant year-on-year change.
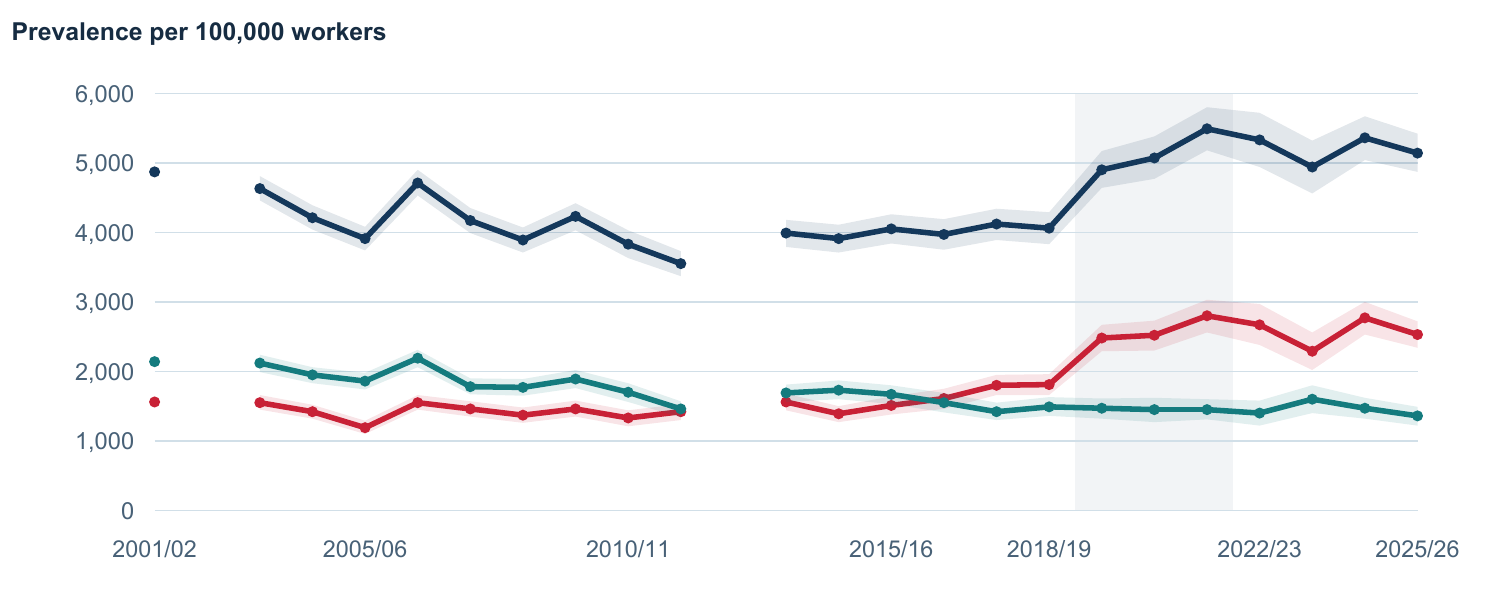
The stress, depression or anxiety rate remains about 40% above its 2018/19 level. It has shown no consistent trend across the latest four years. Musculoskeletal disorder rates have been broadly flat across those four years and are similar to pre-pandemic rates.
Work-related ill health accounts for about 88% of working days lost. Stress, depression or anxiety alone accounts for about 46% of the combined injury and ill-health total. The cost estimate of £24.6 billion is a three-year rolling estimate centred on 2024/25, expressed in 2025 prices.
See the lost working days and cost charts
Which long-latency health outcomes are declining in Great Britain?
Mesothelioma deaths fell to 2,146 in 2024, down from a revised 2,255 in 2023 and about 14% below the 2011 to 2020 annual average. HSE projects a further decline.
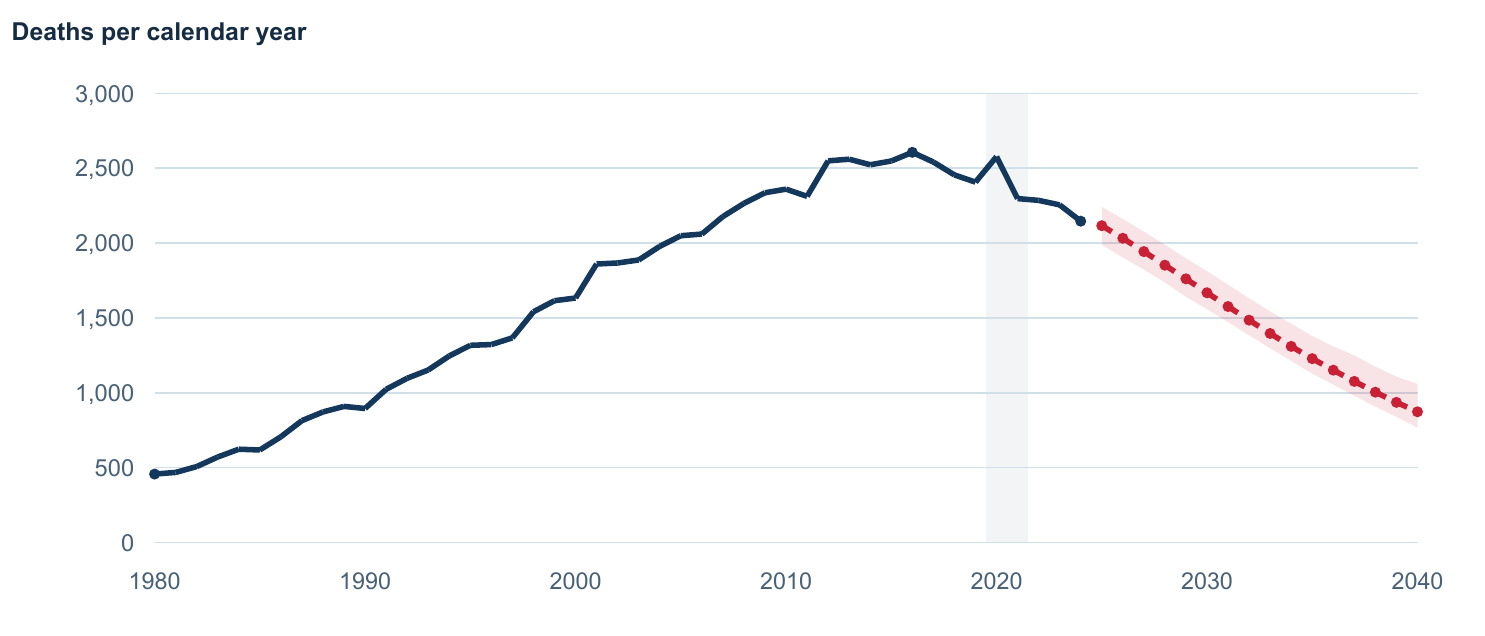
The pattern fits the ageing of groups exposed heavily in earlier decades and their replacement by groups with lower historic exposure. This is a plausible explanation for a disease that can develop decades after exposure. The national series cannot isolate the effect of individual regulations or measure exposure from today’s work.
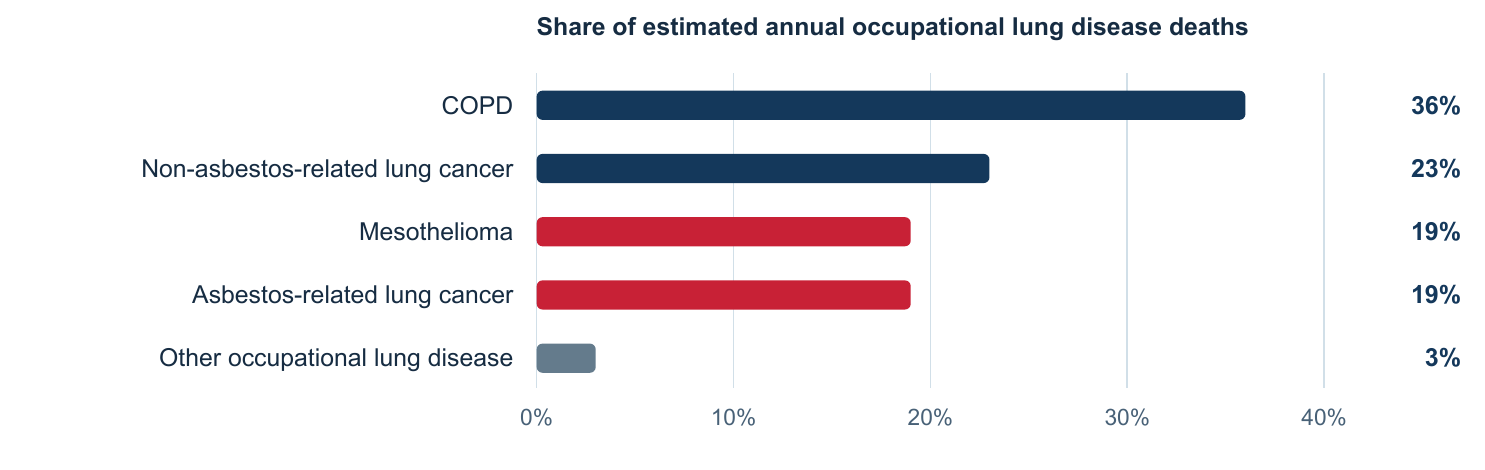
HSE estimates about 11,000 annual occupational lung disease deaths linked to past exposure. It also estimates about 22,000 new self-reported work-related breathing or lung problems per year across 2023/24 to 2025/26. These figures use different sources and measure different outcomes.
See the wider occupational lung disease burden
Which Great Britain industries had higher reported rates?
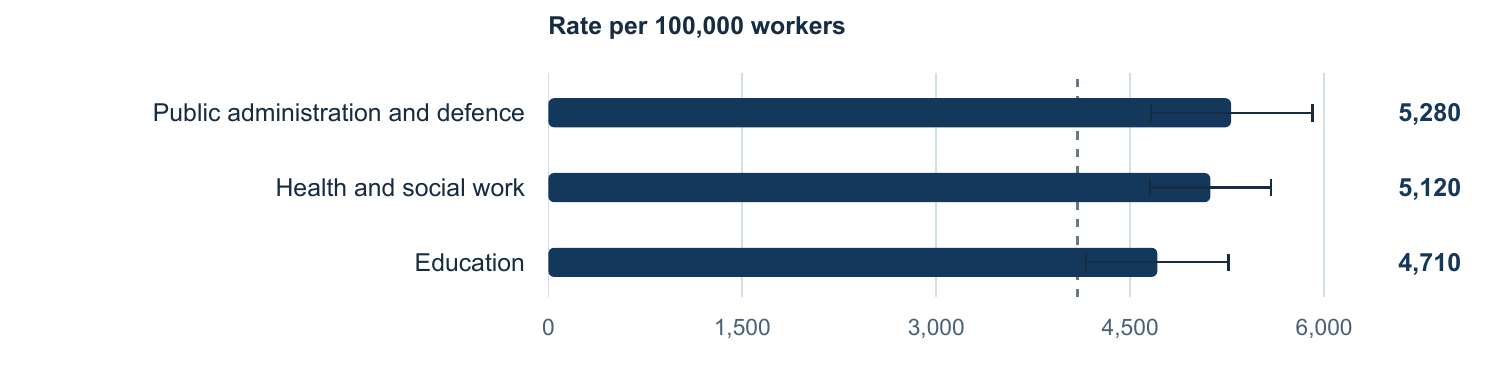
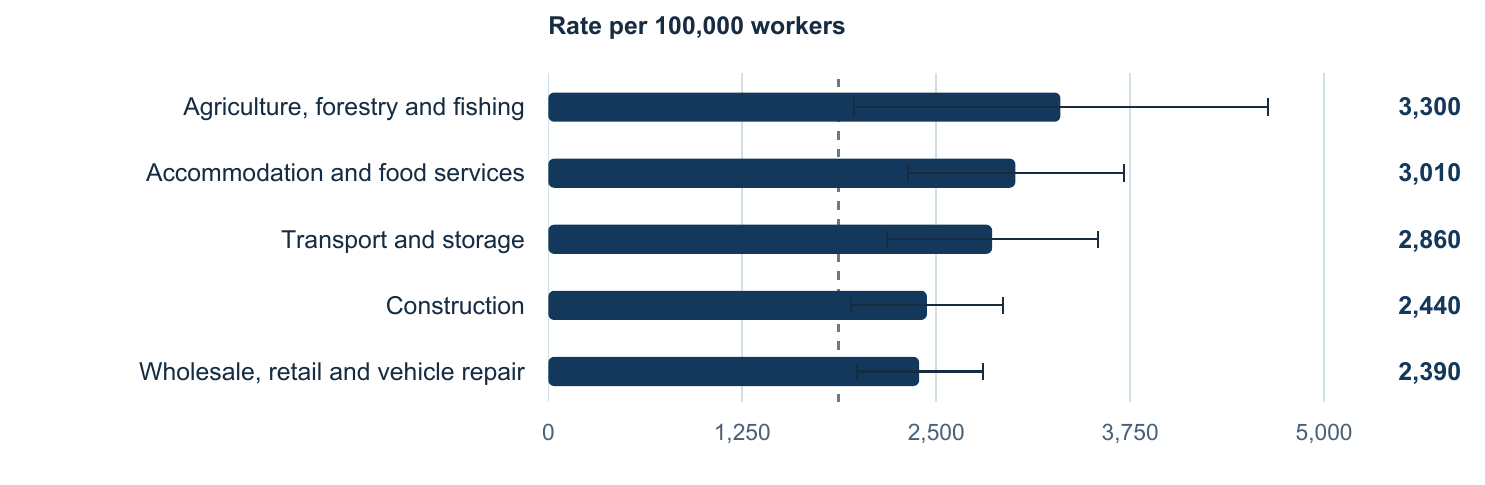
In the 2023/24 to 2025/26 survey window, HSE identified three sectors with higher work-related ill-health rates and five with higher non-fatal injury rates than their corresponding all-industry averages.
Public administration and defence, health and social work, and education had higher work-related ill-health rates. Agriculture, forestry and fishing, accommodation and food, transport and storage, construction, and wholesale, retail and vehicle repair had higher non-fatal injury rates. HSE’s statistical comparisons are against the all-industry benchmark.
See the two industry charts with confidence intervals
Why must the UK do more to prevent fatal and life-changing workplace injuries?
Deaths and serious injuries continue each year despite major historical improvement. Preventing fatal and potentially life-changing harm requires organisations to remove dangerous work conditions and verify that controls remain effective.
Large historical improvements do not make the remaining harm acceptable or demonstrate that today’s controls are effective. Deaths continue each year, and serious injuries can permanently affect mobility, sight, independence and earning capacity. The practical aim is to remove the work conditions that allow fatal or severe injury, while continuing to learn from incidents and workers’ experience.
HSE recorded 126 worker deaths in Great Britain in 2025/26, provisionally. The November 2026 release also records provisional RIDDOR reports of 16,929 specified and 41,369 over-seven-day employee injuries for 2025/26. Worker fatality figures include the self-employed. The non-fatal reports here cover employees. HSE fatal injury statistics and RIDHIST table 3.
Specified injuries are the strongest available consistent serious-injury marker in the modern industry tables. They include defined fractures, amputations and other injuries with the potential for major harm. They are not all confirmed life-changing injuries, and the statistics do not measure how many injured people have a permanent disability. Conversely, permanent harm can also occur outside that category. HSE’s specified injury definitions should govern the wording used in a briefing or dashboard.
The moral conclusion is that sustained prevention remains necessary even where a national trend improves. The operational conclusion is to prioritise credible fatal and severe-injury scenarios, redesign work at source and verify that controls work in real conditions. Neither conclusion depends on attributing the national decline to one programme.
How do workplace fatality and injury statistics differ between Great Britain and Northern Ireland?
HSE’s national statistics principally cover Great Britain: England, Scotland and Wales. Northern Ireland has a separate regulator, legislation and reporting system. A UK title does not turn a GB figure into a UK total.
| Measure | Population and meaning | Important boundary |
|---|---|---|
| Fatal worker injuries | Employees and self-employed people killed in reportable work-related accidents. | Not all deaths caused by work. Most work-related road collisions and occupational disease deaths are outside this series. |
| Public fatal injuries | People not themselves at work, killed in a work-related accident. | Separate from worker deaths. Railway and healthcare reporting changes affect historical comparisons. |
| GB specified injuries | Defined reportable non-fatal injuries. Industry statistics cover employees. | A serious-injury proxy, not a confirmed permanent-disability count. |
| GB over-seven-day injuries | Unable to perform normal duties for more than seven days. | A separate reporting category. Adding it to specified injuries gives the published non-fatal total. |
| Labour Force Survey injuries | Self-reported non-road workplace injuries among people who worked in the previous 12 months. | Survey estimates with uncertainty. Different scope from employer RIDDOR reports. |
| NI major and over-three-day injuries | Categories retained in Northern Ireland reporting. | Do not merge directly with GB specified and over-seven-day categories. |
Rates divide a count by an employment estimate and multiply by 100,000. A count describes the recorded burden; a rate helps compare populations of different size. Neither adjusts fully for hours exposed, the mix of tasks or workforce vulnerability. Fatal worker rates and non-fatal employee rates have different denominators. HSE historical data notes retain the population and employment-source changes.
Non-fatal employer reports are substantially incomplete: HSE estimates reporting of RIDDOR-defined employee injuries at around half overall, with differences between sectors. Do not simply double every industry total. For the overall injury burden, HSE prefers Labour Force Survey estimates; RIDDOR supplies richer incident detail. Non-fatal injuries at work
What do UK historical records show about workplace fatalities since the 1950s?
The earliest official records show substantial harm in regulated industrial populations. They cannot be joined into a single comparable all-UK fatality curve. The chart retains separate early sector lines, the narrower employee series from 1974 and the broader worker series from 1981.

In 1950, a ministerial answer reported 506 fatal factory accidents among 170,371 notified accidents. The answer does not establish a total for all workplaces or Northern Ireland. It is shown as an isolated historical point because its population description cannot be assumed identical to the later factory-only table. 1951 ministerial factory-accident answer
A later ministerial table gives a continuous factory and construction-site series for 1952–1971. Factory fatalities fell from 471 to 299, a calculated count reduction of 36.5%; construction-site fatalities fell from 261 to 196, a reduction of 24.9%. These improvements preceded the 1974 Act. Without workforce or exposure denominators, the percentage changes are count reductions rather than measured changes in individual risk. Full 1952–1971 parliamentary table
Factory, construction, mining, docks and other records use different statutory scopes. Some overlap with broader reporting tables. They must not be added to manufacture a complete UK total, and old notified accidents must not be relabelled as modern specified injuries.
What do UK coal-mining records show about long-term safety trends?
Historical mining records demonstrate both severe harm and substantial change within a high-risk industry. They also show why employment and industrial structure matter when explaining a national decline.
A 1954 parliamentary debate, drawing on National Coal Board reports, recorded 476 deaths in 1950 and 364 in 1953. It cited a combined death-and-serious-injury rate declining from 1.56 to 1.31 per 100,000 man-shifts. This is a combined outcome per work shift, not a modern fatality rate per 100,000 workers. The debate described fire-resistant conveyor belts, stone-dust barriers, strata control and a safety organisation. Those are documented historical engineering and organisational approaches; the speech is contemporary interpretation rather than a controlled causal study. 1954 Mines and Quarries Bill debate

The Health and Safety Commission table supplied to Parliament records 348 coal-miner deaths in 1959, 48 in 1974 and 47 provisionally in 1979. Non-fatal injuries fell from 209.2 thousand in 1959 to 49.6 thousand in 1974. The table does not establish a serious-injury-only definition or an exposure-adjusted rate. 1980 ministerial coal-miner table
As heavy industry and mining contracted and employment moved towards services, the national exposure mix changed. HSE identifies this shift as part of the explanation for long-run reductions. Modern national rates therefore need to be considered with sector rates and the actual work undertaken. A falling national average can coexist with persistent high risks in agriculture, construction or waste operations. HSE historical interpretation
Which laws and developments shaped workplace safety in Great Britain and Northern Ireland?
The statutory framework broadened from sector and premises rules towards general duties, risk assessment, worker consultation and task-specific prevention. These changes provide a credible prevention framework, but the aggregate graph cannot calculate the contribution of each law.
The correct name is the Health and Safety at Work etc Act 1974, which received Royal Assent on 31 July 1974. HSE began on 1 January 1975. The Act’s general duties and the regulator’s creation are related but distinct milestones. Northern Ireland’s general framework is the 1978 Order. Health and Safety at Work etc Act 1974; Public Bodies review of the Health and Safety Executive; HSENI: Employees.
The dates below distinguish enactment or publication from principal commencement. Earlier instruments are historical milestones, not an assertion that their original text is still the current operational law. Reporting rules are identified as measurement changes as well as routes for incident learning.
| Date or period | Milestone | Practical contribution and scope | Authority |
|---|---|---|---|
| 1957-01-01 | Mines and Quarries Act 1954 | Sector-specific statutory framework for mine and quarry management, safety, health and welfare. The Act required owners to make financial and other provision to secure compliance and safe planning. | Official source |
| 1962-04-01 | Factories Act 1961 | Consolidated Factories Acts 1937–1959 and other workplace safety, health and welfare enactments. It represents the pre-HSWA sector/premises approach, rather than the beginning of workplace regulation. | Official source |
| 1972-07-19 | Robens Report | Recommended a single comprehensive legislative framework and a national safety and health authority to replace separate arrangements. The resulting framework placed responsibility on those creating risks. | Official source |
| 1974-07-31 | Health and Safety at Work etc Act 1974 | General employer responsibility for employees’ health, safety and welfare so far as reasonably practicable. Duties encompass safe plant and systems, safe handling/storage/transport, information, instruction, training, supervision, workplaces and welfare. | Official source |
| 1975-01-01 | Health and Safety Executive established | Created an independent regulator for work-related health and safety in Great Britain after HSWA. Northern Ireland has a separate regulator. | Official source |
| 1978-10-01 | Safety Representatives and Safety Committees Regulations 1977 | Framework for recognised trade unions to appoint safety representatives, their functions and employer consultation. Supports worker voice in identifying risks and checking whether protective arrangements work. | Official source |
| 1978 | Health and Safety at Work (Northern Ireland) Order 1978 | Separate general health-and-safety framework for Northern Ireland. Employers and workers must cooperate; employers must manage risks and consult workers. | Official source |
| 1981 | NADOR 1981 reporting coverage | Notification of Accidents and Dangerous Occurrences Regulations broadened reporting to fatal/defined major injuries to employees and self-employed people, and injuries affecting members of the public. | Official source |
| 1986-04-01 | RIDDOR 1985 | Reporting of Injuries, Diseases and Dangerous Occurrences Regulations 1985 operated from 1 April 1986, providing a broader reporting framework. | Official source |
| 1989-10-01 | COSHH 1988 | Required assessment of health risks from hazardous substances, prevention or adequate control of exposure, maintenance and testing of controls, monitoring, surveillance and training. | Official source |
| 1990-04-01 | Electricity at Work Regulations 1989 | Requirements for electrical systems, protective arrangements, isolation, live working precautions and competence. | Official source |
| 1993 | European Framework Directive and six-pack regulations | Management, manual handling, display-screen equipment, workplace health/safety/welfare, work equipment and personal-protective-equipment regulations put prevention and risk assessment on a more systematic basis. | Official source |
| 1996-04-01 | RIDDOR 1995 | A single set of reporting requirements; reports alert enforcing authorities to incidents and reveal where risks arise. Statutory accident definition included non-consensual workplace physical violence. | Official source |
| 1996 | Health and Safety (Consultation with Employees) Regulations 1996 | Required consultation where workers are not represented by union-appointed safety representatives, directly or through elected representatives. | Official source |
| 1999-12-29 | Management of Health and Safety at Work Regulations 1999 | Replaced 1992 management regulations. Requires suitable/sufficient risk assessment and arrangements; prevention principles include avoiding risk, addressing risk at source, adapting work and prioritising collective protection. | Official source |
| 1999 | HSG 48 human-factors guidance | HSE’s broad human-factors approach considers task design, equipment, individual capabilities and organisational influences, including fatigue, communication and safety culture. | Official source |
| 2001–2004 research/publications, with continued HSE guidance | Behavioural-safety research and caution | Observation, feedback, workforce engagement and visible management can support occupational safety. HSE lists 2001 best-practice research and 2002 CRR 430, plus a 2004 major-hazard critique. | Official source |
| 2005-04-06 | Work at Height Regulations 2005 | Dedicated regulatory framework for preventing fall risks during work at height. | Official source |
| 2007-07-26 | Corporate Manslaughter and Corporate Homicide Act 2007 | Clarified corporate criminal liability for gross breaches of a duty of care causing death, where serious senior-management failures are involved. | Official source |
| 2012-04-06 | RIDDOR 2012 reporting-threshold change | Changed the reportable incapacitation threshold from over-3-days to over-7-days and submission time from 10 to 15 days. Over 3 day injuries still had to be recorded. | Official source |
| 2013-10-01 | RIDDOR 2013 | Replaced major injuries with a shorter specified-injury list, reduced disease categories and dangerous-occurrence reporting categories. Fatal-accident and over-7-day requirements did not significantly change. | Official source |
| 2015-04-06 | Construction (Design and Management) Regulations 2015 | Emphasises construction-client arrangements and coordinated management; introduces the principal-designer role for projects involving more than one contractor and requires risk elimination or control during design and preconstruction. | Official source |
Interpretation: the timeline supports a history of growing responsibilities and prevention capability. It does not demonstrate that the 1974 Act, behaviour-based safety, an individual regulation or moral pressure caused a specified percentage fall in the fatality rate. That would require an appropriate counterfactual and control for simultaneous changes in industry, exposure and reporting.
How has Great Britain’s worker fatal injury rate changed since 1981?
Great Britain’s worker fatality rate has fallen substantially since 1981. HSE nevertheless describes a slowing rate of improvement in recent decades, and the remaining annual deaths justify sustained action.

The source rates are 2.10 deaths per 100,000 workers in 1981 and 0.37 in 2025/26p, an arithmetic endpoint reduction of approximately 82.4%. Worker counts fell from 495 to 126, a reduction of 74.5%. Rate and count reductions differ because the denominator and workforce changed. The historical notes identify broadly consistent fatal-count coverage from 1981, while employment sources and some sector comparisons changed later. HSE reported fatal and non-fatal injury history; HSE main industry fatality data July 2026.
The 1974 headline of 651 is an employee count under narrower historical reporting coverage. It is not a 1974 all-worker rate. A direct 651-to-126 percentage comparison mixes employees with workers and different coverage. HSE’s historical method restricts later employee totals to improve comparability with 1974; it should not be replaced by an unqualified comparison. HSE Historical picture 2025
Recent annual counts still move between years. In the latest rolling five-year period, 2021/22–2025/26p, 651 workers died, an annual average of 130.2. Its published pooled fatal injury rate is 0.39 per 100,000 workers. One year’s fall is not enough to establish a sustained trend or prove a particular policy worked.
Why must Great Britain’s RIDDOR trends show changes in reporting rules?
A reporting regime determines which injuries enter the count. When that regime changes, a jump or fall in reports can occur without an equivalent change in real-world harm.

Under the 1981–1985 Notification of Accidents and Dangerous Occurrences Regulations (NADOR), the non-fatal series covers a prescribed major-injury list. From April 1986, the Reporting of Injuries, Diseases and Dangerous Occurrences Regulations (RIDDOR) added over-three-day injuries. RIDDOR 1995, effective April 1996, broadened the major-injury and violence-reporting scope. The resulting level changes have a measurement explanation. Historical reporting-regime notes
In April 2012 the GB reporting threshold moved from over three days to over seven days. In October 2013 specified injuries replaced the major-injury list. The 2013/14 year spans the transition. Rail and offshore non-fatal injuries are excluded from the HSE series from 2012/13; Office for Nuclear Regulation workplaces are excluded from 2024/25. These are reasons to mark breaks, not evidence that the excluded workplaces had no injuries. HSE Historical picture 2025 and HSE reported fatal and non-fatal injury history.
HSE’s published historical comparison adjusts older non-fatal rates to approximate today’s reporting scope. Its annex describes an estimate that around 72% of injuries reported under the older rules were in scope of the newer rules. Figure 4 instead presents the source rates without applying a new adjustment and retains the breaks. A percentage reduction across those breaks would be misleading.
Under-reporting also has a history. A 1963 ministerial answer described a survey estimate that about 40% of reportable Factories Act accidents were not being reported. A 1970 ministerial response warned that changes in notification and social conditions made gross report counts a poor stand-alone safety-performance measure. Those estimates describe their particular historical populations; they are not universal correction factors. Factories Act, 1961 (Accidents), HC written answers 31 July 1963; Industrial Safety debate, Lords 28 October 1970.
What does the Labour Force Survey show about injury trends in Great Britain?
The Labour Force Survey (LFS) estimates injury across a wider population and range of severity than employer reporting. HSE finds a long-run decline and a broadly flat rate over the latest four years.

The all-injury rate fell from 3,980 per 100,000 workers in 2000/01 to 2,060 in 2025/26, about 48% lower. The latest estimated count is 688,000 (95% CI 628,000–748,000). The rate interval is 1,880–2,240 per 100,000. HSE found no statistically significant difference from the 2024/25 rate of 2,070. HSE LFSINJSUM table 1.
About 145,000 self-reported injuries in 2025/26 involved more than seven days’ absence. This LFS measure includes workers covered by the survey. RIDDOR employee reports and permanent disability statistics have different definitions. HSE LFSINJSUM table 3.
Pandemic effects changed exposure, furlough and survey conditions, particularly in 2020/21. Comparing later activity with that low year can overstate an apparent deterioration. Retain the confidence interval and the same population, period and injury definition in any local briefing. HSE pandemic interpretation report
What do Great Britain’s specified injury trends show about potentially life-changing harm?
HSE’s November 2026 tables record 16,929 provisional specified employee injuries in Great Britain in 2025/26, compared with a revised 18,132 in 2024/25.

The published specified-injury rate fell from 69 per 100,000 employees in 2014/15 to 59 in 2025/26. That endpoint comparison is about 14.5% lower using rounded rates. The counts, 18,047 and 16,929 respectively, are about 6.2% lower. Changes in the number of people employed affect the relationship between counts and rates. HSE RIDHIST table 3.
The archived study used the November 2025 workbook. Its 2020/21 to 2024/25 specified-injury total of 85,234 belongs to that publication vintage. For the current comparison and accident-kind breakdown, see the 19 November 2026 injury trends.
Fractures, amputations, sight injuries and crush injuries should lead organisations to examine the energy or exposure that reached the person. Clinicians determine diagnosis and prognosis; a statistical category cannot decide whether an individual’s injury will be permanent or when they can return to work.
Which industries account for the most worker deaths in Great Britain?
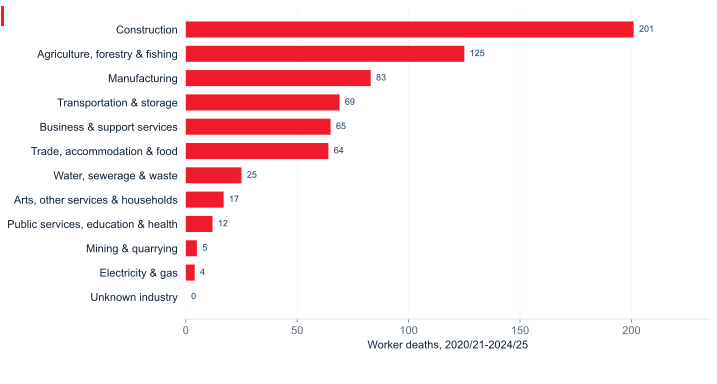
For 2020/21–2024/25, current revised main-industry figures record 670 worker deaths in Great Britain. Construction and agriculture, forestry and fishing account for 326 deaths, or 48.7%, despite their very different workforces.
| Industry | 2020/21 | 2021/22 | 2022/23 | 2023/24 | 2024/25 | Total |
|---|---|---|---|---|---|---|
| Agriculture, forestry & fishing | 34 | 23 | 21 | 24 | 23 | 125 |
| Mining & quarrying | 0 | 1 | 3 | 0 | 1 | 5 |
| Manufacturing | 19 | 22 | 15 | 16 | 11 | 83 |
| Electricity & gas | 1 | 1 | 1 | 1 | 0 | 4 |
| Water, sewerage & waste | 7 | 3 | 7 | 4 | 4 | 25 |
| Construction | 40 | 29 | 47 | 50 | 35 | 201 |
| Trade, accommodation & food | 14 | 11 | 14 | 11 | 14 | 64 |
| Transportation & storage | 11 | 16 | 15 | 10 | 17 | 69 |
| Business & support services | 16 | 13 | 8 | 14 | 14 | 65 |
| Public services, education & health | 1 | 1 | 2 | 4 | 4 | 12 |
| Arts, other services & households | 2 | 3 | 3 | 4 | 5 | 17 |
Construction records 201 deaths, 30.0% of the total. Agriculture records 125, 18.7%; manufacturing 83, 12.4%; transportation and storage 69, 10.3%. Those four groups account for 71.3%. These are burden shares, not a workforce-risk ranking. HSE main industry fatality data July 2026 and HSE detailed industry data November 2025.
For the latest fatality window, 2021/22–2025/26p, HSE’s pooled agriculture rate is 8.08 per 100,000 workers, about 20.7 times the all-industry rate of 0.39. Construction is 1.78, about 4.6 times the all-industry rate. The waste collection and treatment division has a rate of 4.03; it is a subset within water, sewerage and waste and must not be added again to the total. These pooled rates use HSE’s matching employment denominators. Published pooled industry rates
How does Great Britain’s serious injury burden compare across industries?
Severe non-fatal harm is a broad workplace issue. Large service industries appear near the top of the specified-injury count ranking, alongside manufacturing and transport.
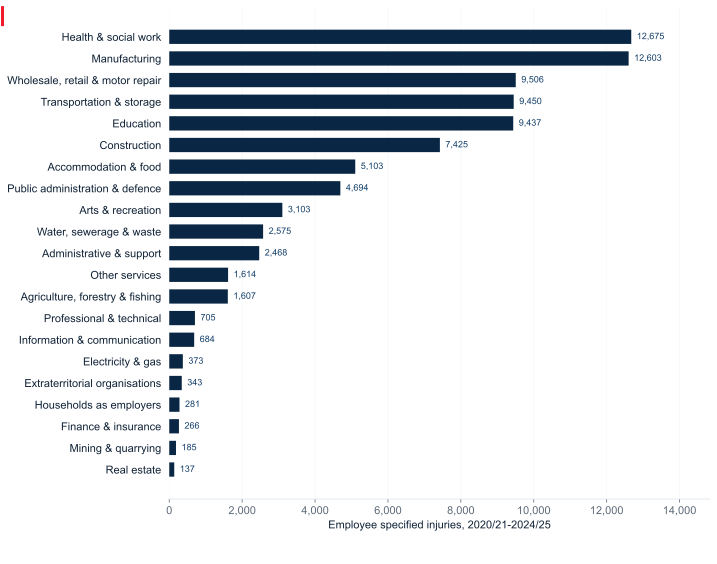
Health and social work recorded 12,675 specified injuries and manufacturing 12,603. Wholesale, retail and motor repair recorded 9,506; transportation and storage 9,450; education 9,437. Those five sectors account for 63.0% of the reported specified total. Workforce size and reporting behaviour both affect the ranking. Detailed industry injury tables
| SIC | Industry | Specified 5 years | Over-7-day 5 years | Non-fatal 5 years | 2024/25 specified rate |
|---|---|---|---|---|---|
| A | Agriculture, forestry & fishing | 1,607 | 1,946 | 3,553 | 257 |
| B | Mining & quarrying | 185 | 290 | 475 | 40 |
| C | Manufacturing | 12,603 | 36,268 | 48,871 | 101 |
| D | Electricity & gas | 373 | 888 | 1,261 | 40 |
| E | Water, sewerage & waste | 2,575 | 6,765 | 9,340 | 218 |
| F | Construction | 7,425 | 12,005 | 19,430 | 115 |
| G | Wholesale, retail & motor repair | 9,506 | 25,289 | 34,795 | 63 |
| H | Transportation & storage | 9,450 | 28,941 | 38,391 | 163 |
| I | Accommodation & food | 5,103 | 12,431 | 17,534 | 78 |
| J | Information & communication | 684 | 1,555 | 2,239 | 9 |
| K | Finance & insurance | 266 | 374 | 640 | 4 |
| L | Real estate | 137 | 211 | 348 | 12 |
| M | Professional & technical | 705 | 1,250 | 1,955 | 7 |
| N | Administrative & support | 2,468 | 4,825 | 7,293 | 49 |
| O | Public administration & defence | 4,694 | 13,559 | 18,253 | 41 |
| P | Education | 9,437 | 13,293 | 22,730 | 66 |
| Q | Health & social work | 12,675 | 44,444 | 57,119 | 58 |
| R | Arts & recreation | 3,103 | 3,207 | 6,310 | 105 |
| S | Other services | 1,614 | 2,800 | 4,414 | 66 |
| T | Households as employers | 281 | 474 | 755 | 249 |
| U | Extraterritorial organisations | 343 | 696 | 1,039 | 166 |
The latest specified-injury employee rate is 257 per 100,000 in agriculture, 218 in water, sewerage and waste, 163 in transportation and storage and 115 in construction. A sector with fewer injuries may have greater risk per employee. Small categories such as households and extraterritorial organisations require particular care when interpreting rates.
These reports exclude self-employed non-fatal injuries and exclude rail and offshore incidents. ONR workplaces are also excluded from 2024/25. The workbook retains all 110 published industry categories, including overlapping totals and divisions; use a single aggregation level to avoid double counting.
Why must UK comparisons separate GB worker deaths, public fatalities and Northern Ireland reports?
Worker deaths, deaths to members of the public and Northern Ireland reportable deaths have different populations or reporting rules. Retain those distinctions rather than publishing a misleading combined UK count.
The matched GB study period records 406 fatal injuries to members of the public: 63, 88, 73, 86 and 96 annually from 2020/21 to 2024/25. The newest 2025/26 provisional public count is 104. The public series includes work-related railway fatalities and excludes CQC-registered patient and service-user deaths in England from 2015/16. Historical railway suicide and trespass reporting also changed. HSE reported fatal and non-fatal injury history; HSE main industry fatality data July 2026.
| Year | All reportable fatal injuries | Major injuries | Over-three-day injuries |
|---|---|---|---|
| 2020/21 | 13 | 188 | 1,770 |
| 2021/22 | 19 | 283 | 2,106 |
| 2022/23 | 10 | 289 | 2,276 |
| 2023/24 | 17 | 312 | 2,299 |
| 2024/25 | 14 | 265 | 2,383 |
| Five-year total | 73 | 1,337 | 10,834 |
The NI table covers HSENI and district council reports. Its five-year fatal count is 73; major injuries total 1,337. This is not the same worker-only fatal population or specified-injury category used in GB. A complete compatible NI SIC-section injury series is not supplied by these tables, so the detailed industry analysis here remains GB-specific. HSENI annual report, printed pages 40–41.
Use HSENI’s NI reporting route for a Northern Ireland workplace. GB’s 2012 and 2013 changes did not automatically change NI’s 1997 reporting framework.
What helps explain Great Britain’s long-term progress and persistent workplace harm?
The most defensible explanation is a combination of safer technology and work systems, broader duties, competent management, worker participation and a changing industrial workforce. The national series does not assign a measured share to every factor.
HSE identifies employment movement away from mining, manufacturing and heavy industry towards services as one contributor to lower fatality levels. Its historical report also cites research estimating that around half of the 1986–2003 fall in the non-fatal injury rate reflected occupational-structure change, with the remainder involving residual factors including real safety improvements. That finding concerns a specific historical analysis; it is not a formula for splitting today’s improvement or measuring the effect of the 1974 Act. HSE Historical picture 2025
Engineering can prevent access to dangerous energy or remove exposure. Effective management maintains those controls, plans non-routine work, supplies resources and learns from failures. Consultation adds knowledge of how work actually happens. Those mechanisms explain why prevention measures are relevant; evidence of national chronology alone does not prove how many lives each mechanism saved. Managing risk using PPE and the hierarchy of control; HSE Managing for health and safety HSG65; HSE: What the law says about consulting workers.
Possible reasons for persistent harm include exposure to vehicles, height, moving equipment and unstable loads, together with failures in planning, separation, maintenance or control during change. The latest HSE accident-kind counts support attention to those mechanisms: in 2025/26, falls from height account for 31 worker deaths, moving vehicles 24, moving objects 21, collapsing or overturning objects 18 and moving machinery 10. These five categories account for 104 of 126 deaths, 82.5%. They identify prevention targets, not the root causes of every case. Work-related fatal injuries overview
Neither a rising number of regulations nor a low national rate establishes compliance at a workplace. Organisations need evidence that their own material risks are controlled, particularly during maintenance, cleaning, breakdowns, contractor interfaces and unfamiliar work. An injury-free period can occur while a rare high-consequence hazard remains uncontrolled.
How do behavioural safety, human factors and moral duties inform UK prevention?
Behavioural observation can support safe work when it improves the conditions that shape behaviour. It cannot replace hazard elimination, engineering safeguards or management responsibility.
Behaviour-based safety (BBS) is a dispersed family of programmes rather than one UK-wide intervention with a single adoption date. The timeline marks HSE behavioural-safety research and publications in 2001–2004, not a claim that the country adopted BBS then. Observation and feedback may reveal a difficult task or an unreliable procedure. They should prompt review of equipment, work design and the pressures affecting decisions. HSE behavioural safety research; Behavioural safety approaches.
HSE warns that behavioural approaches can focus on easy-to-observe actions, transfer attention to individual workers and neglect engineering, management and low-frequency high-consequence risks. A rising observation score alongside deteriorating safeguards is not evidence of reduced serious risk. Its major-hazard critique is particularly relevant where an organisation uses personal-injury indicators to assess fire, explosion or catastrophic release risk. Behavioural safety and major accident hazards 2004
Human factors encompasses the job, the individual and the organisation: task complexity, displays, staffing, fatigue, supervision, competence and production demands. HSG48 and HSE’s introduction support that wider analysis. Calling the outcome “operator error” does not explain why the system allowed the error to reach a person. HSE Reducing error and influencing behaviour HSG48; Human factors introduction.
Moral and social responsibilities are continuing reasons to protect workers and others, listen to people exposed to risk and support those affected by harm. HSE’s leadership guidance recognises the moral case alongside legal and organisational reasons. The ethical conclusion is to sustain prevention because people continue to be killed and seriously injured; it is not a statistically measured moral-pressure effect. Why health and safety leadership matters
How should UK organisations use Great Britain and Northern Ireland statistics to prevent harm?
Use statistics to direct attention, then test the work and the controls. A dashboard becomes useful when it leads to a specific prevention decision and verified action.
Prioritise serious harm rather than the easiest count to reduce
Identify tasks capable of a fatal or permanent injury: work at height, vehicle movements, lifting, dangerous machinery, stored energy, confined spaces and harmful exposures. Check routine and non-routine conditions and people outside the immediate workforce. The national accident-kind evidence gives a starting point; the workplace risk assessment determines the local priority. Managing risks and risk assessment at work
Redesign before relying on individual compliance
Apply the five-level hierarchy: eliminate the hazard, substitute, engineer separation, organise the remaining work and use suitable personal protective equipment for residual risk. The related ERICPD teaching framework adds sustained discipline through supervision, maintenance and learning; it must not be interpreted as blaming workers or bypassing stronger measures. Managing risk using PPE and the hierarchy of control
Check whether critical controls work
Inspect physical separation, edge protection, isolation and guarding in their actual operating conditions. Confirm the owner, acceptance criteria and response to failure. Where a safeguard is missing or cannot be verified, stop or restrict the affected exposure while a competent decision is made. Inspection activity alone is not the result: the result is an effective control that continues to work. HSE Managing for health and safety HSG65
Improve reporting without punishing disclosure
Encourage reporting of injuries and high-potential events. Review severity and exposure rather than incentivising silence. An initial increase after better reporting may represent improved visibility; assess case circumstances, rates and control evidence before assigning a safety-performance judgement. Investigate the underlying conditions and verify that actions address the harm pathway. Investigating accidents and incidents HSG245
Keep health harm alongside accident prevention
Fatal-accident statistics omit most occupational-disease mortality. Dust, fume, noise, vibration and work design can produce harm on a different timescale. Low accident counts do not establish control of those exposures. The historical report shows different trends for injury and ill health. HSE Historical picture 2025
How can UK organisations apply the findings to yards and maintenance work?
A high national rate is a prompt to examine exposure, not a substitute for a task assessment. These examples are illustrative management decisions rather than incident records or universal specifications.
Warehouse deliveries cross a pedestrian route
A warehouse manager reviews a near miss involving a reversing delivery vehicle and a picker crossing to the loading area. The task exposes drivers, employees and visitors to moving vehicle energy. Before the next delivery, the supervisor holds the crossing movement and checks the actual vehicle paths with workers and drivers. The preferred redesign removes the crossing or unnecessary reversing; if that is not practicable, provide engineered separation and a controlled crossing suited to the vehicles and visibility. Separating pedestrians and vehicles
The manager approves the layout and resources. Before release, a competent supervisor tests sightlines, gate operation, route continuity and the loading interface without exposing pedestrians to live movements. During use, report damage, encroachment or work changes immediately. Stop the affected movement if the barrier or crossing control fails. Brief drivers and visitors on the remaining arrangements. Keep the layout decision, verification, defects and corrective actions; hand the route back only when the required controls are effective.
Short roof-maintenance work is proposed from a ladder
A facilities manager is asked to approve a roof inspection. A short duration does not remove the fall hazard. Establish the exact location, roof condition, fragile surfaces, people below and method. Avoid the work at height if the inspection can be completed from a safe location. If access remains necessary, a competent planner selects suitable collective protection and a method that prevents a fall. The chart’s national fall count is context, not permission to use a ladder. Working at height a brief guide
The responsible supervisor checks the actual access, protection, weather and rescue arrangements before work. Unknown roof condition or failed protection is a hold point. During work, changes in the method, access or conditions require review. Completion includes safe removal or retention of protection, control of the area below and documented hand-back. Record the assessment, method selection, competence and protection checks; training and PPE do not compensate for an unsuitable method.
Who needs competence to interpret UK statistics and verify workplace controls?
People need different capabilities to interpret statistics, plan work and check controls. Training should be assessed against the actual decision and repeated when change or failure shows a gap.
| Role | Learning and decision | Evidence of competence | Review trigger |
|---|---|---|---|
| Workers and representatives | Recognise serious-harm exposure, use the reporting route and raise failed controls. | Can explain task stop points and report a concern without confusing a near miss with a reporting category. | New task, changing conditions or unclear instruction. |
| Supervisors and coordinators | Review methods and interfaces; verify prerequisites before exposing people. | Can demonstrate a hold, correction and restart decision using the actual work area. | Defect, contractor change, incident or altered method. |
| Managers and designers | Compare counts and rates; resource elimination and engineered controls; review actions. | A defensible prevention decision, named control owner and verification of effective delivery. | New equipment, layout, workload or credible serious-harm scenario. |
| Safety advisers and analysts | Use matching geography, population, definition, denominator and source vintage. | Can reproduce a figure, explain a break or uncertainty and distinguish fact from causal inference. | New release, revised data, methodology change or source conflict. |
| Auditors and reviewers | Sample controls and action closure rather than relying on dashboards alone. | Evidence of the control in real use, conditions of failure and independent follow-up. | Critical-control failure, new assurance scope or unresolved action. |
Track outcomes alongside prevention evidence: serious-harm incidents, employee or exposure-adjusted rates where denominators are sound, critical-control failures, completion and verification of corrective actions, and worker concerns resolved. Do not set an incentive that discourages injury reporting. No universal course, certificate renewal period or dashboard target follows from these national statistics. HSE Managing for health and safety HSG65
What should UK organisations conclude from Great Britain and Northern Ireland statistics?
There is much more to do to reduce fatal and potentially life-changing harm. Historical reductions show that improvement is possible; the continuing burden shows that prevention must remain an active management responsibility.
First, progress is real but its explanation is shared. Long-term rates are substantially lower, with changing industry and exposure alongside safer work and broader duties. The timeline cannot allocate the decline to a single law or behavioural approach.
Second, the serious-injury marker remains substantial. The modern specified count is close to its 2014/15 level and the last complete five years contain more than 85,000 reports. Under-reporting means this is not the full burden, and the category does not quantify confirmed permanent disability.
Third, priorities need both burden and risk. Construction has the largest matched-period fatal count; agriculture has the highest main-industry pooled fatal rate. Manufacturing, health and social work, trade, transport and education contribute large specified-injury burdens. Organisations should identify the corresponding local harm pathways rather than assume every workplace in a sector has the same risk.
Fourth, stronger assurance should accompany every dashboard. Check whether dangerous energy or exposure is eliminated, separated or controlled, particularly during non-routine work. Verify actions, learn from high-potential events and protect honest reporting. The intended output is less exposure to serious harm, not a cosmetically lower report count.
Finally, keep claims within the evidence. Retain GB/NI boundaries, source revisions, reporting breaks and survey uncertainty. Present plausible reasons as mechanisms or interpretation unless a suitable evaluation establishes a causal effect. HSE Historical picture 2025; HSE detailed industry data November 2025; HSE main industry fatality data July 2026; HSE Managing for health and safety HSG65.
Which HSE data release should be used for comparisons within Great Britain?
Use the 19 November 2026 annual release and the matching current HSE workbooks. Great Britain’s 2025/26 worker fatality count remains provisional until July 2027.
HSE revised the 2024/25 worker fatality count from 124 to 128. It also revised the 2024/25 employee non-fatal injury count from 59,219 to 59,931, including 18,132 specified injuries and 41,799 over-seven-day injuries. Use the revised figures for year-to-year comparisons.
The archived detailed studies and charts retain the period and figures available when produced. The 2026 release includes detailed 2025/26 industry tables. HSE RIDIND industry tables and HSE RIDHIST historical tables.
Which questions clarify UK coverage and reporting in Great Britain and Northern Ireland?
The key questions concern geographical coverage, the meaning of specified injuries, the limits of the historical timeline and whether a fall in reports demonstrates reduced risk.
Is 126 the number of all UK deaths caused by work?
No. It is the provisional GB count of workers killed in RIDDOR-reportable work-related accidents in 2025/26. Northern Ireland, occupational disease mortality and most work-related road deaths are outside that headline.
Sources: HSE main industry fatality data July 2026, HSE statistical data sources, HSENI reporting an incident
Do specified injury counts measure lifelong disability?
No. Specified injury is a statutory reporting category with potentially serious outcomes. It does not record a confirmed permanent-disability outcome for every injured person.
Sources: Specified reportable injuries, HSE detailed industry data November 2025
Can the historical graph prove that behaviour-based safety saved a particular number of lives?
No. It provides chronology and source data, not a counterfactual evaluation of programme effects. HSE cautions that behavioural focus can neglect engineering, management and major-hazard controls.
Sources: Behavioural safety approaches, Behavioural safety and major accident hazards 2004, HSE Historical picture 2025
Does a falling injury report count prove risk is falling?
Not by itself. Reporting definitions, workforce, exposure and under-reporting can change the count. Check matching rates, severity, source scope and the effectiveness of controls.
Sources: HSE reported fatal and non-fatal injury history, Non-fatal injuries at work, HSE Managing for health and safety HSG65
Can the 1950 and modern figures be combined into one comparable UK curve?
No. Earlier sources cover different regulated populations and do not establish a complete UK series. The chart retains separate lines and the 1981 HSE population break.
Sources: Factory Accidents, HC Deb 6 December 1951 vol 494 c299W, Industrial Safety, HC written answers 5 December 1972, HSE reported fatal and non-fatal injury history
How can the hierarchy of controls turn workplace-transport risk evidence into effective loading-bay controls?
How can the ERICPD hierarchy of controls turn workplace-transport risk evidence into effective loading-bay controls?

| Control level | Control for this activity | Owner and verification | Stop / restart decision |
|---|---|---|---|
| Eliminate | Move pedestrian access and picking away from the loading route so the crossing is no longer needed. | Transport owner observes the revised pedestrian journey and a representative delivery; confirm people no longer need to cross the truck route, including visiting drivers. | If the hazardous step remains, keep it within the task assessment and select the stronger feasible remaining controls. |
| Reduce, including substitution | Replace reversing-dependent unloading with a suitable drive-through arrangement after checking vehicle swept paths. | Transport designer trials the drive-through swept path with the actual vehicle and checks that a new blind crossing or reversing manoeuvre has not been introduced. | Reject an alternative if its performance is unproved or its new hazards are unresolved. |
| Isolate | Install suitable fixed separation and protected crossing points; design gates and routes to keep people out of the truck envelope. | Supervisor checks the actual boundary, affected people and connected work; verify separation or isolation before allowing access. | Hold or stop for damaged barrier, pedestrian intrusion or an unplanned reversing manoeuvre. |
| Control: physical safeguards | Check barrier strength, visibility, impact exposure and safe bay access for the actual trucks and loads. | Competent equipment/process owner checks route separation, crossing sightlines and representative truck movements. | Hold or stop for damaged barrier, pedestrian intrusion or an unplanned reversing manoeuvre. |
| Control: work method and response | Agree delivery slots, driver waiting positions and crossing rules; stop vehicle movement before anyone enters the loading zone. | Supervisor confirms the work limits, competent cover, communication and stop/restart authority with the people doing this activity. | Hold work when the agreed limits, competent cover or effective communication cannot be maintained. |
| PPE | Use suitable visibility and foot protection for residual exposure; high-visibility clothing does not prevent a collision. | Assessor confirms whether personal protection is needed and checks suitability, condition, compatibility and any required fit evidence. | Do not use unsuitable protection or rely on PPE to continue after an essential source control fails. |
| Discipline | Inspect barriers after impacts, prevent informal shortcuts and verify the route at busy periods. | Release only after transport manager verifies routes with drivers and pedestrians. Retain verification and unresolved restrictions at handover. | Keep the task on hold until required reinstatement evidence and unresolved defects are accepted by the responsible owner. |
How can the ISO 45001 hierarchy of controls turn workplace-transport risk evidence into effective loading-bay controls?

| Control level | Control for this activity | Owner and verification | Stop / restart decision |
|---|---|---|---|
| Elimination | Move pedestrian access and picking away from the loading route so the crossing is no longer needed. | Transport owner observes the revised pedestrian journey and a representative delivery; confirm people no longer need to cross the truck route, including visiting drivers. | If the hazardous step remains, keep it within the task assessment and select the stronger feasible remaining controls. |
| Engineering controls | Replace reversing-dependent unloading with a suitable drive-through arrangement after checking vehicle swept paths. | Transport designer trials the drive-through swept path with the actual vehicle and checks that a new blind crossing or reversing manoeuvre has not been introduced. | Reject an alternative if its performance is unproved or its new hazards are unresolved. |
| Engineering controls | Install suitable fixed separation and protected crossing points; design gates and routes to keep people out of the truck envelope. | Supervisor checks the actual boundary, affected people and connected work; verify separation or isolation before allowing access. | Hold or stop for damaged barrier, pedestrian intrusion or an unplanned reversing manoeuvre. |
| Engineering controls | Check barrier strength, visibility, impact exposure and safe bay access for the actual trucks and loads. | Competent equipment/process owner checks route separation, crossing sightlines and representative truck movements. | Hold or stop for damaged barrier, pedestrian intrusion or an unplanned reversing manoeuvre. |
| Administrative controls | Agree delivery slots, driver waiting positions and crossing rules; stop vehicle movement before anyone enters the loading zone. | Supervisor confirms the work limits, competent cover, communication and stop/restart authority with the people doing this activity. | Hold work when the agreed limits, competent cover or effective communication cannot be maintained. |
| PPE | Use suitable visibility and foot protection for residual exposure; high-visibility clothing does not prevent a collision. | Assessor confirms whether personal protection is needed and checks suitability, condition, compatibility and any required fit evidence. | Do not use unsuitable protection or rely on PPE to continue after an essential source control fails. |
| Administrative controls | Inspect barriers after impacts, prevent informal shortcuts and verify the route at busy periods. | Release only after transport manager verifies routes with drivers and pedestrians. Retain verification and unresolved restrictions at handover. | Keep the task on hold until required reinstatement evidence and unresolved defects are accepted by the responsible owner. |
What do the terms used in Great Britain and Northern Ireland injury statistics mean?
The terms below distinguish regulators, reporting systems, injury categories and statistical measures. A specified injury is a reporting category, not a confirmed count of permanent disability.
| Term | Full meaning | Meaning in this topic |
|---|---|---|
| HSE | Health and Safety Executive | Regulator and publisher of GB workplace health and safety statistics. |
| HSENI | Health and Safety Executive for Northern Ireland | NI regulator with a separate legal and statistical route. |
| HSWA | Health and Safety at Work etc Act 1974 | General GB health and safety framework; HSE began in 1975. |
| RIDDOR | Reporting of Injuries, Diseases and Dangerous Occurrences Regulations | Statutory incident reporting. GB and NI definitions differ. |
| NADOR | Notification of Accidents and Dangerous Occurrences Regulations | Pre-RIDDOR reporting framework applying in 1981–1985. |
| LFS | Labour Force Survey | Sample survey providing injury estimates and uncertainty. |
| SIC | Standard Industrial Classification | Industry classification; totals, sections and divisions may overlap. |
| BBS | Behaviour-based safety | Observation and feedback approaches; not a substitute for control at source. |
| COSHH | Control of Substances Hazardous to Health | Risk assessment and prevention or control of harmful substance exposure. |
| CDM | Construction Design and Management | Framework for planning, design and management of construction work. |
| ONR | Office for Nuclear Regulation | Its workplaces are excluded from these non-fatal statistics from 2024/25. |
| CQC | Care Quality Commission | English registered patient/service-user deaths have a separate reporting scope. |
| ERICPD | Eliminate Reduce Isolate Control PPE Discipline | Teaching framework; discipline sustains controls and is not worker blame. |
| PPE | Personal protective equipment | Residual protective equipment after stronger control measures. |
| Specified injury | Defined reporting category | Serious-injury marker, not proof of permanent disability. |
| Incidence rate | Cases per 100,000 in a matching population | Use the same period, population and denominator. |
| Confidence interval | Range reflecting sample uncertainty | Not a guarantee that the estimate is unbiased. |
| Provisional | Subject to later finalisation | Retain status and source vintage with the figure. |
Which Great Britain and Northern Ireland research documents and data can be downloaded?
Download the SHAREhub analysis of HSE’s 19 November 2026 release, the historical research and the supporting workbooks and chart data. The archived studies retain their original data periods.
- SHAREhub report on the HSE statistics release of 19 November 2026 (PDF)
- Historical research document with direct source hyperlinks
- Five-year graphical study
- Editable five-year data workbook
- Historical source library and chart data
- Long-term fatality chart data CSV
- Reported injury history and definitions CSV
- LFS chart data with confidence intervals CSV
An organisation can also create a serious-harm scenario register, critical-control verification record and corrective-action review. Those are local management records, not universal statutory templates.